Today LeadSafeMama.com passed 166,500 page views for March (already better than March 2020 & still 10 days to go)! Baby steps.
Here’s today’s back-end stats for LeadSafeMama.com.
Below the image, I will go over some of the exciting highlights 🙂
You can click on the image of the chart below to see it in full size if you like.
March 21, 2021 — Lead Safe Mama Stats Highlights:
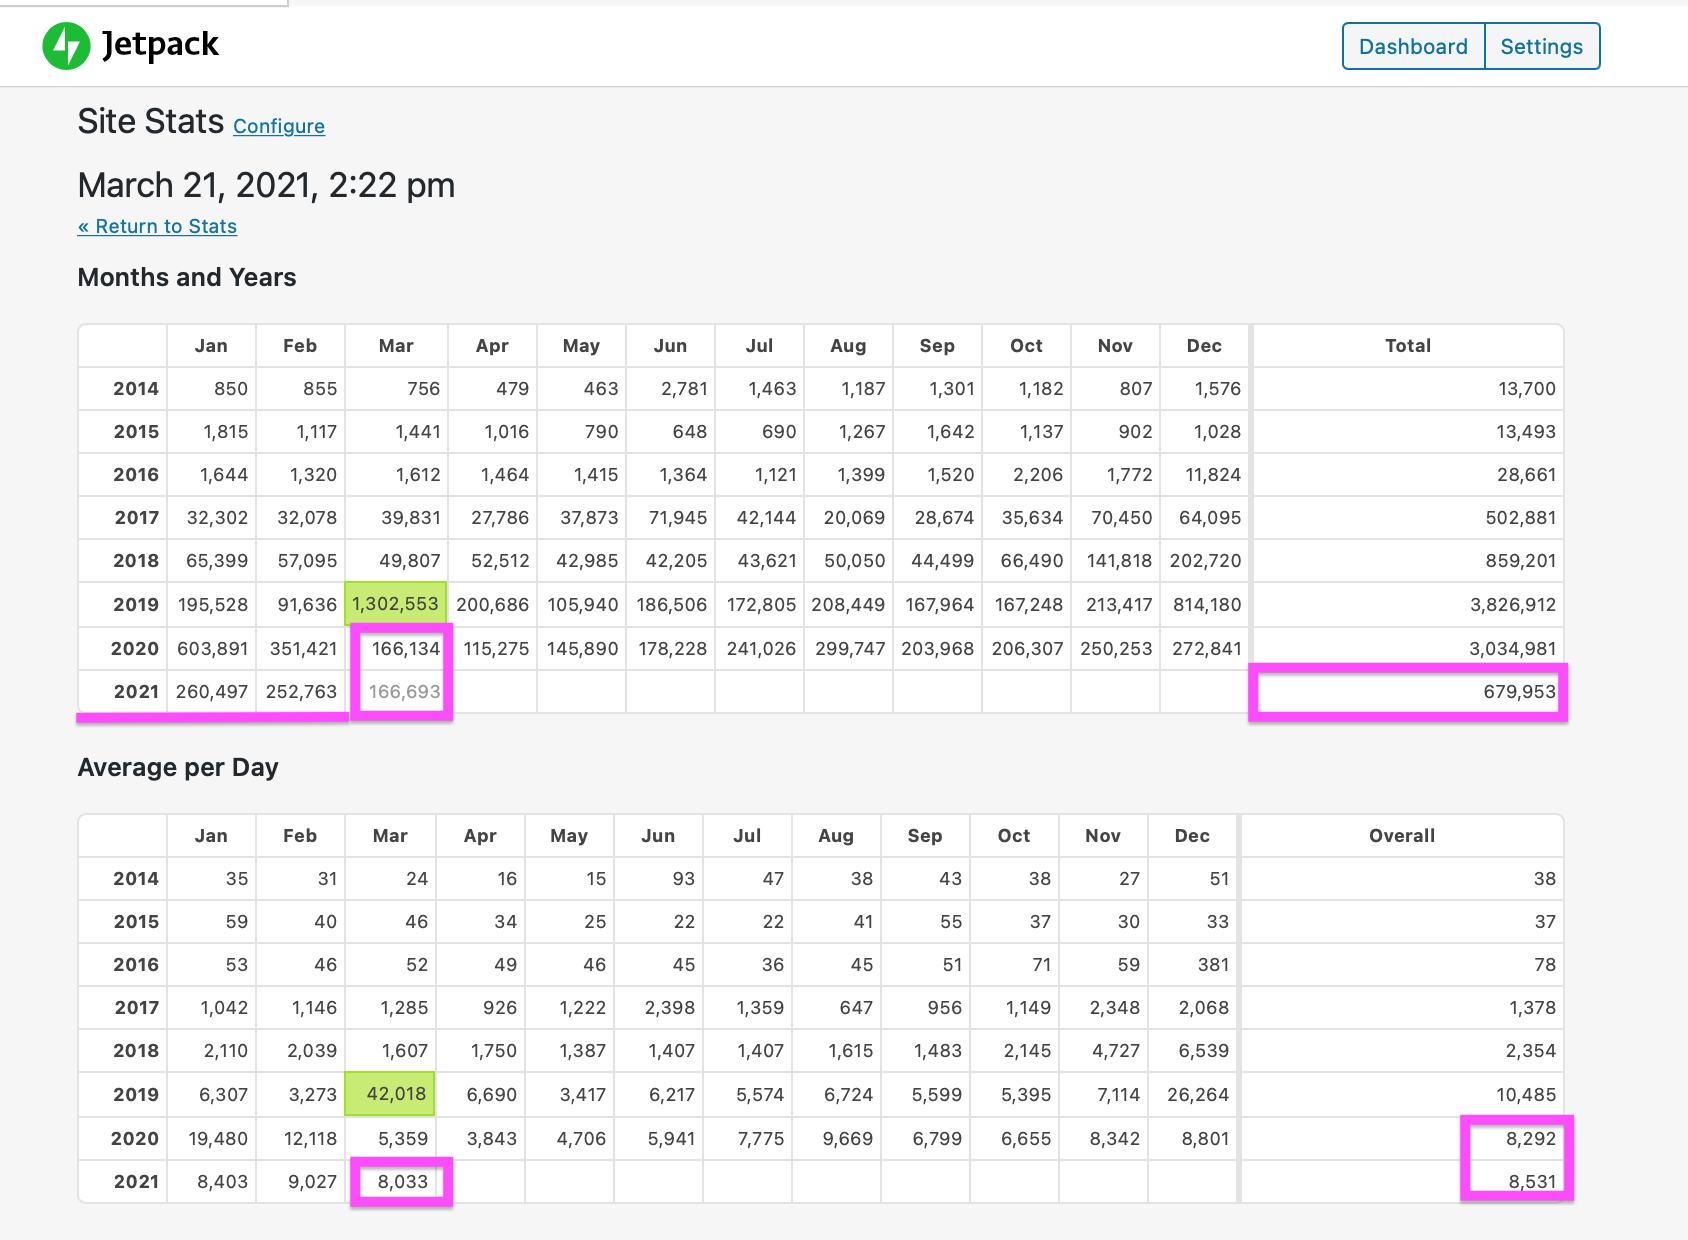
- All of March 2020 had only 166,134 page views. It was a dismal month (especially compared to March 2019!) where everything tanked because everyone and anyone who was normally interested in reading about health-related topics (including childhood Lead poisoning prevention) had 99%+ of their attention focused on news about COVID-19. As of the moment of the screen capture above (from earlier today), March 2021 has already passed that number (with 166,693 page views) and at this rate will likely reach 250,000 page views (or thereabouts) by the end of the month.
- Looking at average page views through yesterday (3/20) of 8,033 per day, March 2021 will likely close out with at least 8,033 x 31 page views. This would be 249,023 page views for the month. Things ramp up on the weekends and we still have today (Sunday) as well as one more weekend to factor in — so I think 250,000 is an achievable goal! (With your help sharing Lead Safe Mama articles in your social media feeds, we could totally pass that, too!)
- The average daily page views for this year are quite a bit better than last year overall so that’s exciting, too! At 8,531 x 365, we might see as many as 3,113,815 page views by the end of the year (hopefully that’s a low-end estimate and I would love to get back to closer to what we saw in 2019). 🙂
- With the way things have been going, my (low-end, achievable) goal for the year is to have at least 250,000 page views each and every month this year. At 12 x 250,000 by the end of the year, this would put us squarely at 3,000,000 views for the year (which — while still recovering from the impacts of COVID-19 on the news cycles — is not bad).
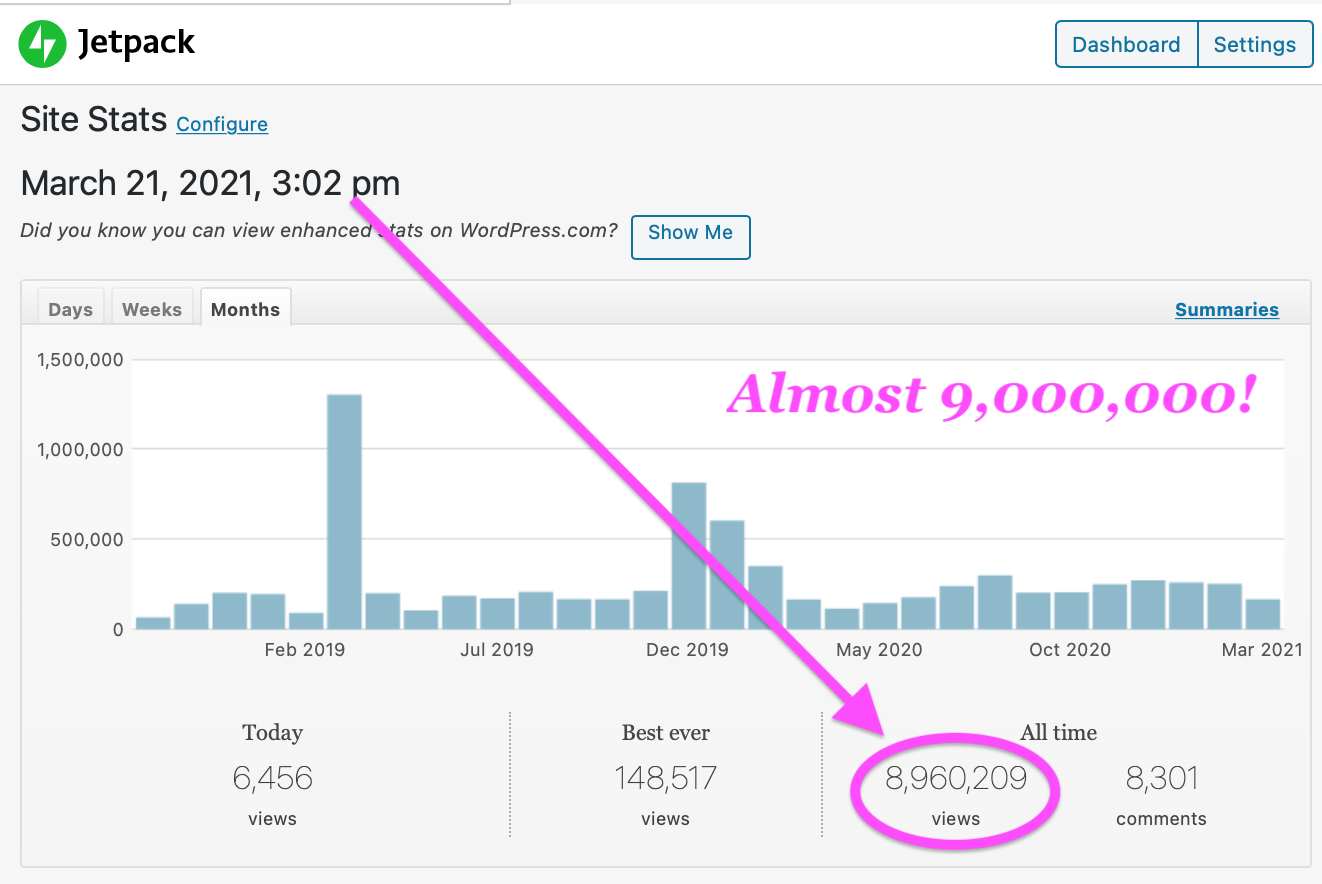
- Also exciting… this month we will be passing 9,000,000 all-time views on the website! Pretty cool from any perspective, especially when you note that MOST of those views have been in the past 2.5 years! What this means is that if things continue along the same trajectory we will likely pass 11,500,000 all-time views by the end of the year! Wow!
Continue reading below the graph!
Why does any of this matter? Why are you sharing these numbers?
The reason this matters is that about 50% of Lead Safe Mama, LLC’s income comes from people reading our articles. We have calculated that the work of the Lead Safe Mama team will be fully self-sufficient (cover all of our costs, including paying all of the people who collaborate with us on this work each year) when we reach 600,000 page views each month (which would work out to 7,200,000 page views each year).
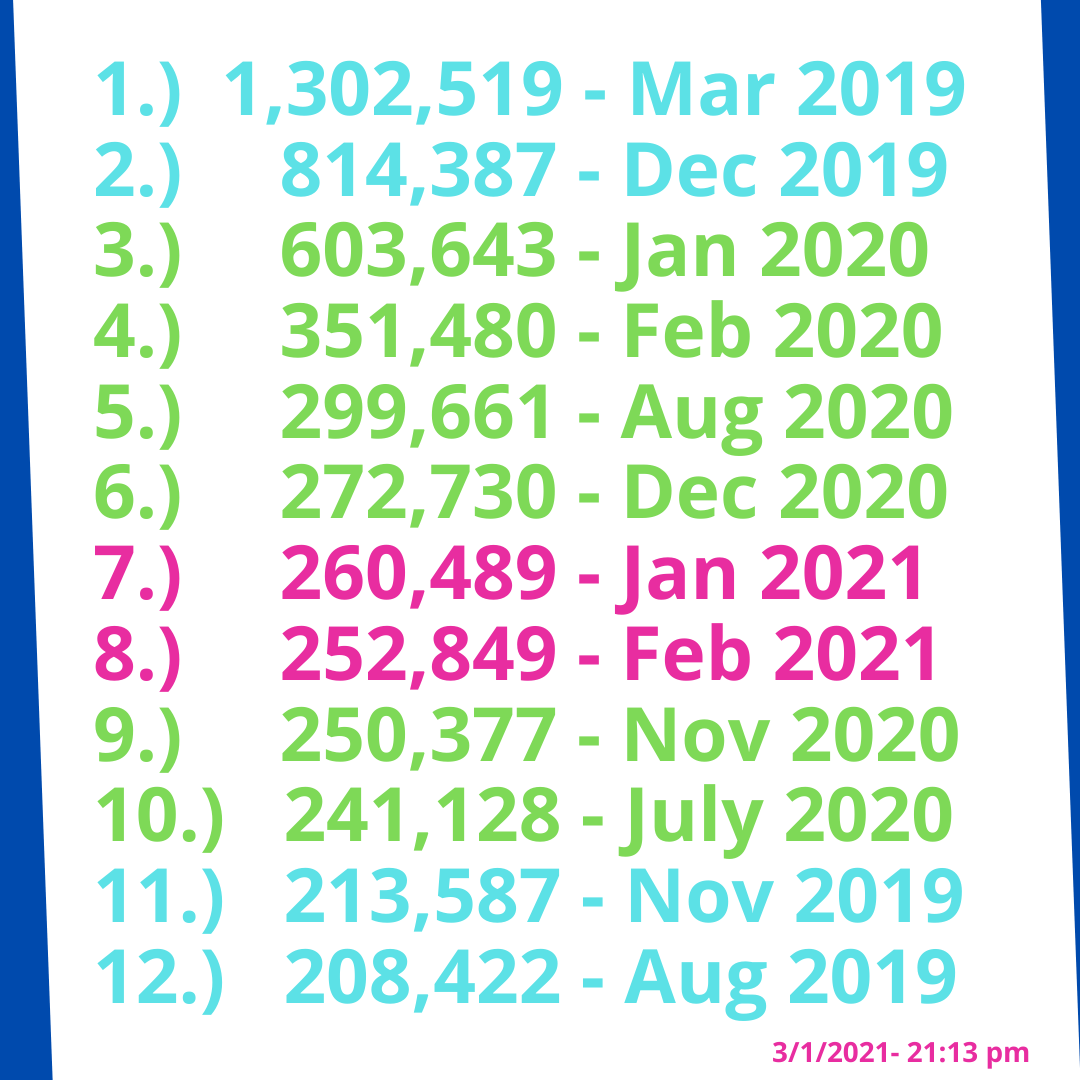
Reaching this milestone has happened four months before (March 2019, December 2019, and January 2020) and could easily happen again. Our traffic has been slowly building as more people are made aware of this work every day. To wit: Each of the past four months (November and December 2020 + January and February of 2021) has made it into the top 10 months of all time here on the Lead Safe Mama website (see below)!
As we build traffic here on the site (as we work towards the goal of covering ALL of the costs of this work) we are also building the movement and protecting more and more children every day. So it is a Win/Win/Win situation to shoot for this goal of 600,000 monthly page views. Informing readers of these goals (writing them down periodically and giving an update on our progress in that direction) also “puts them into existence” and helps to make them a reality.
So, thank you for being here! Thank you for being part of this movement. Thank you for your role in helping generate the successes we continue to achieve. Let’s keep it going!
Tamara Rubin
#LeadSafeMama
Never Miss an Important Article Again!
Join our Email List


