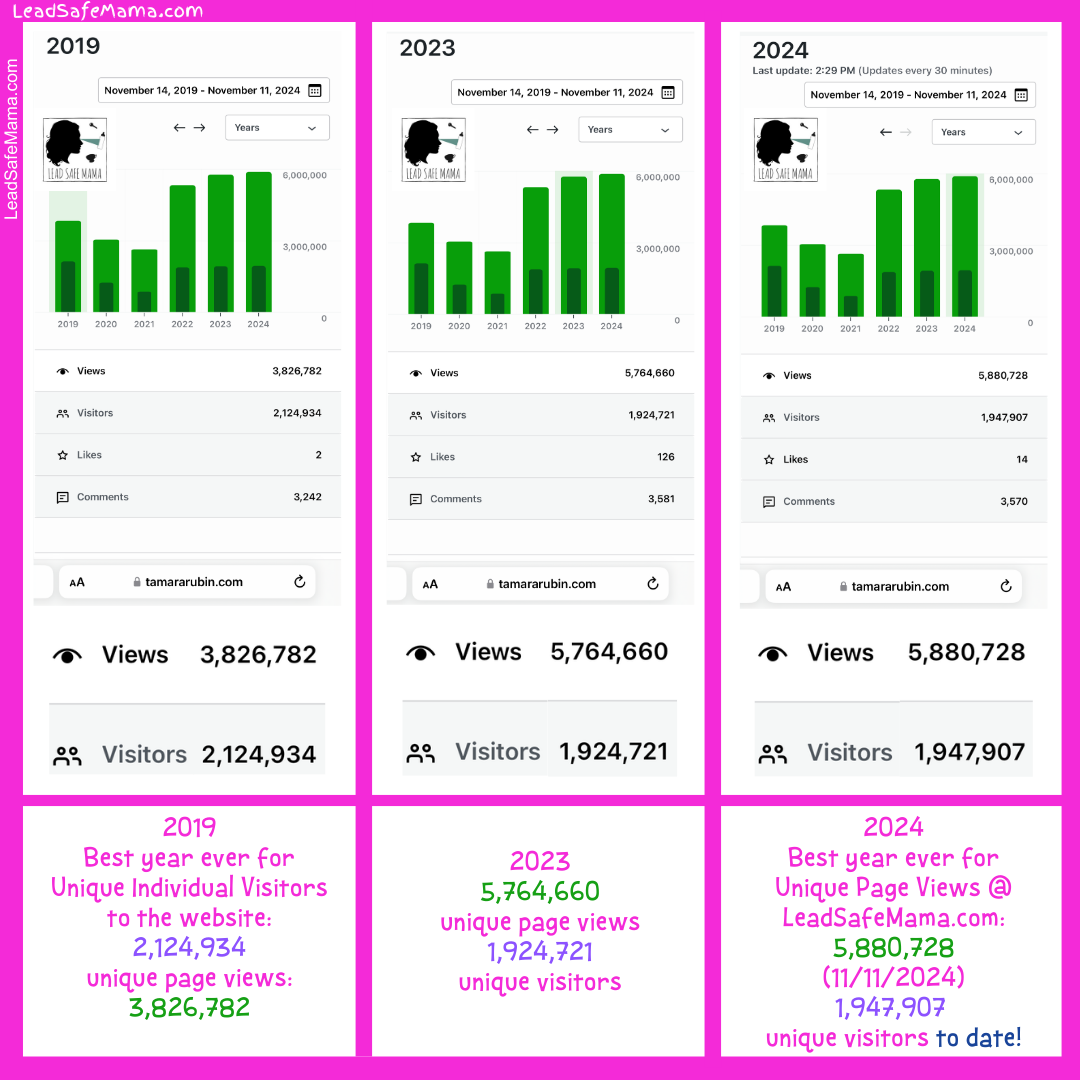
More on Lead Safe Mama, LLC’s #BestYearEver (to date) — 2024
#SiteStats | #Stats | 2024 Stats | Ad-Free Article | Annual Goals | Goal | Goals | Goals 2024 | Site Stats | Stats | Stats Graph
The graphic below was published on Instagram & Facebook — November 11, 2024
I thought looking at these three years (2019, 2023, and 2024) side by side by side as a visual would make a fun comparative analysis of our recent growth (and recovery since the pandemic)!
Thanks for being here!
Thank you for being part of this movement for childhood Lead poisoning prevention and consumer goods safety.
I think it would be a lot of fun if we passed 2019’s “unique individual visitors” number this year as well! (Then this would be our absolute best year when looking at every metric for engagement! #Goals)

To make a contribution that helps us keep our most widely-read articles ad-free, click here. Thank you.
Never Miss an Important Article Again!
Join our Email List


