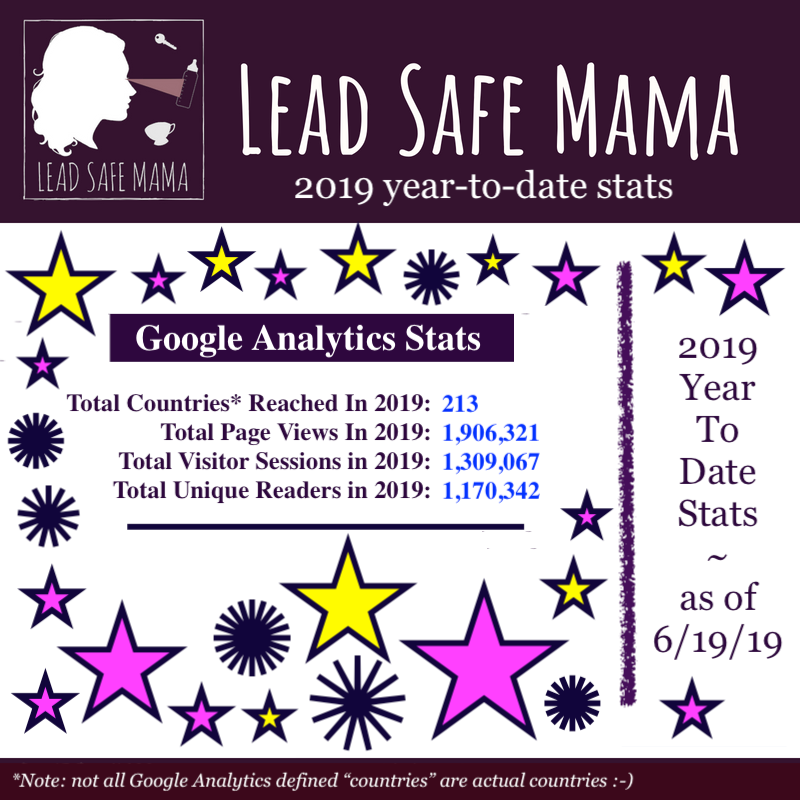
#LeadSafeMama Year To Date Stats: 1,906,321 page-views by 1,170,342 readers in 213 “countries” so far this year!
Final stats post for the moment… this one is the most fun (in my opinion!)
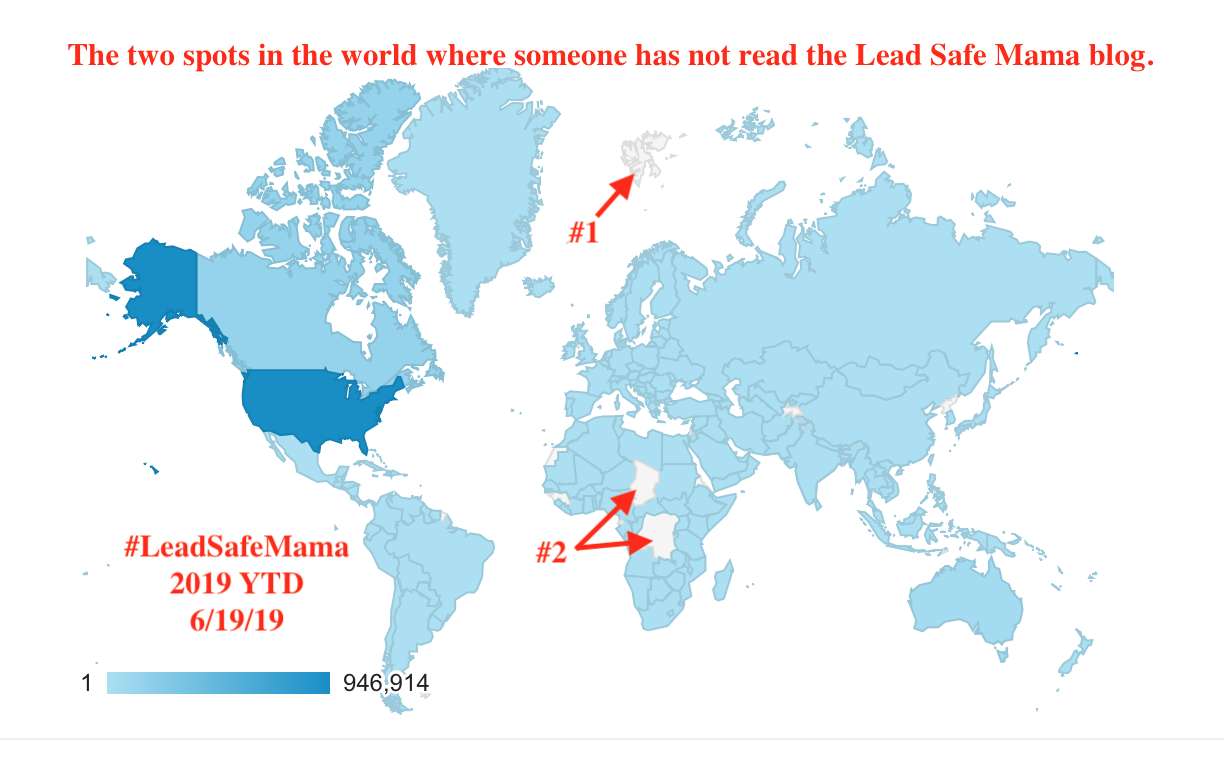
For those who have as much fun as I do following my website and social media stats, here are my stats for this entire year to date! I’m sharing these stats along with a map (a screenshot from Google Analytics, above) of all the countries where people have read my blog (filled in in varying shades of blue depending on the numbers of people reading in that location.)
The red arrows (in the image above) point to the only two geographic locations where my blog has not yet been read this year… #1) The North Pole & #2) Central Africa!
Want to see a full list of all of the 213 “countries”
(with how many #LeadSafeMama readers there are in each country)? Click here.
Thank you for reading (and thank you for sharing my posts – because that’s what generated these numbers! – you sharing my posts with your friends.)
It’s truly amazing to have this map as a visual of the difference we are making together – showing how far and wide this message (to protect children from environmental toxicity in general and from Lead exposure specifically) has spread.
As always, please let me know if you have any questions!
Tamara Rubin
#LeadSafeMama
Never Miss an Important Article Again!
Join our Email List


What are some lead free options for storage of food, sugar, flour? Was so sad to hear Tupperware was high in lead content.
Hi Val! this is a picture of my food pantry: https://tamararubin.com/2017/03/food/
My answer: Ball Jars! (affiliate link) https://amzn.to/2Fo3B6A
Tamara