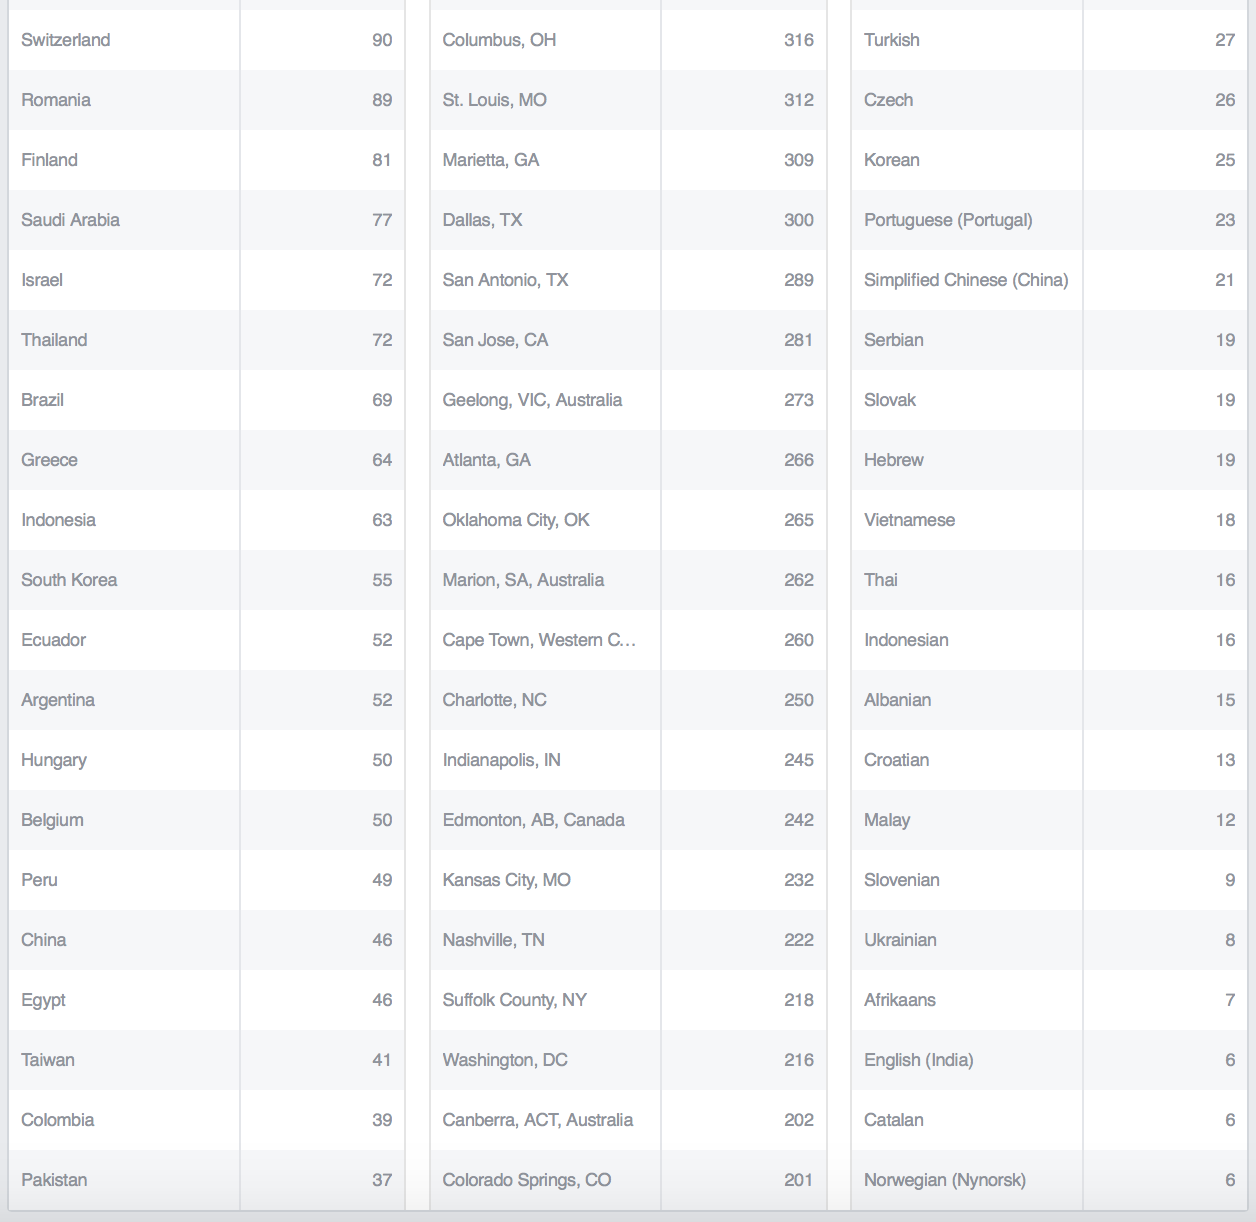
Facebook Reach (Past 28 days!) #MoreFunFacts
Here’s a chart showing the international impact of my Facebook reach for the past 28 days (on just one of my pages)… this is also a super fun set of information! Look at all the countries represented! There are three images below (because I could not capture the full chart in one screenshot) and they each overlap a little so you can see where they go together.
Click on each of the images to see them full size if you can’t quite read them (because you are old – like me and don’t have glasses yet – like me!).
This is the impact that we (together) are having on bringing the message of childhood lead poisoning prevention to the world… and these numbers just represent the past 28 days!
Thank you!
Never Miss an Important Article Again!
Join our Email List


