Comparative Chart of Independent, Third-Party Laboratory Test Results for 365 Whole Foods Market Brand Products


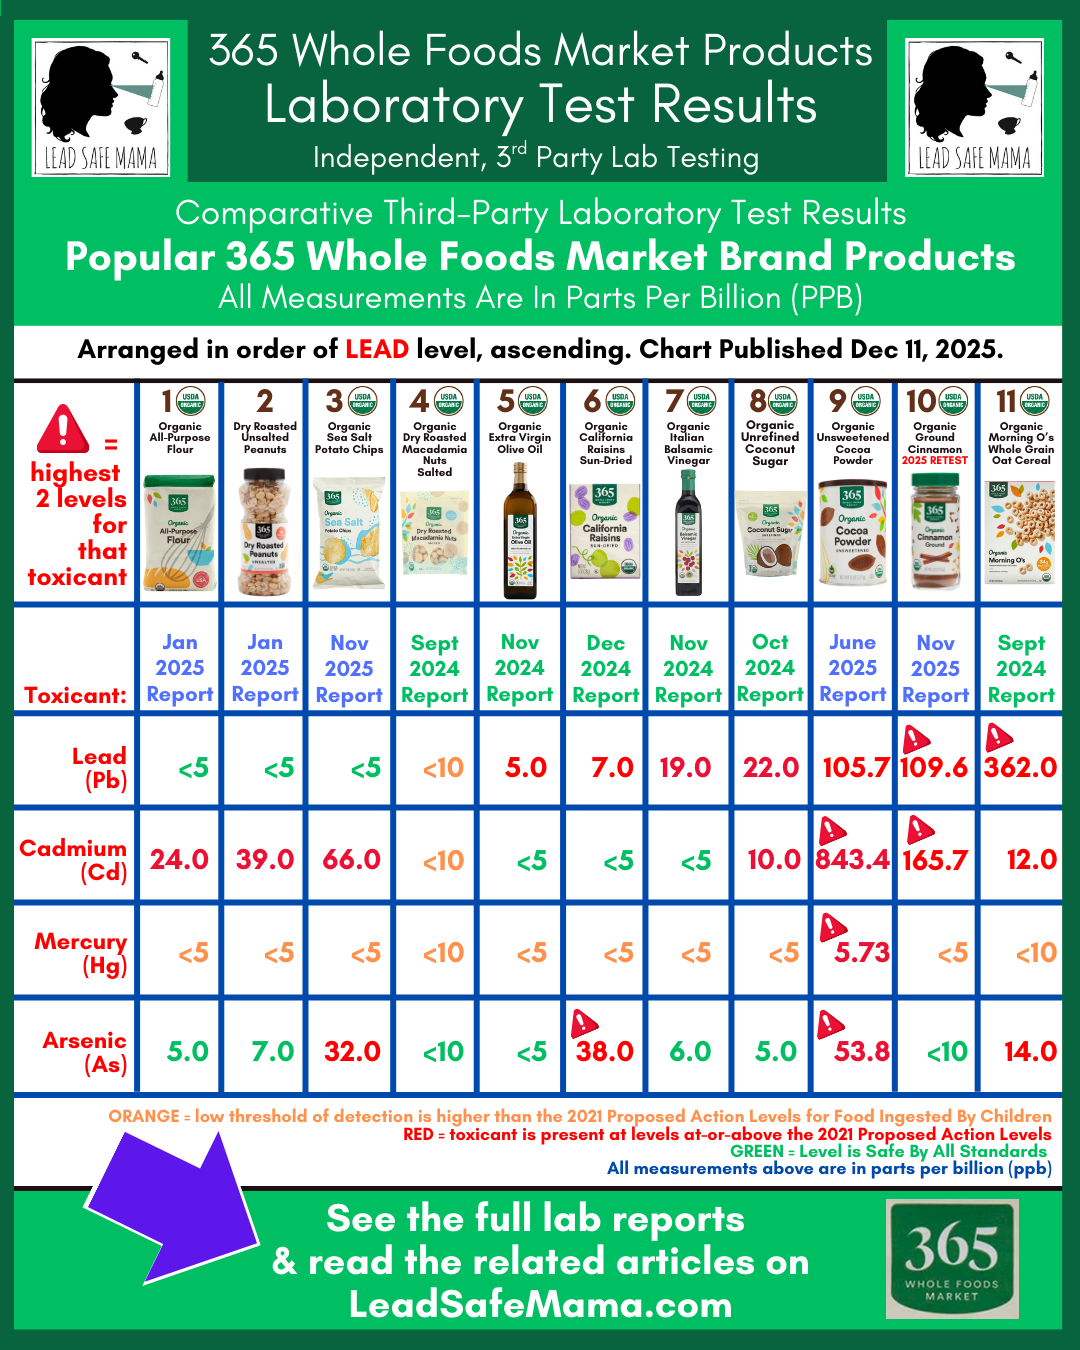
Published: December 11, 2025
A Note from Tamara Rubin
The above chart can be saved to your desktop or to your phone by either dragging it to your desktop or by clicking on it and choosing save image. We thought it would be helpful for our readership to have access to these comparative test results in a handy chart across the Whole Foods brand. We have published quite a few of these comparative charts to date — some “product type” specific, and some brand specific. You can find all of our comparative charts by clicking this link.
Relative to the Whole Foods Products included above, we have also already published comparative charts with laboratory testing results for the following categories – that include some of the products show in the chart above (with more in the queue, to be published shortly):
- Flour Products
- Nuts and Seed Products
- Cinnamons: Sticks and Powders (organic and conventional)
- Cocoa Powders
- & Potato Chips
To be among the first to see our lab reports when they are published, join us on Patreon. You can join for FREE or with a small monthly contribution in support of the Lead Safe Mama, LLC Community Collaborative Laboratory Testing Initiative.. Patreon Link Here.
Articles with Lab Reports for the Products in the Above Chart:
- Dry Roasted Peanuts – Conventional
- Organic Macadamia Nuts, Salted (not yet published)
- Organic All Purpose Wheat Flour
- Organic Sun-Dried California Raisins
- Organic Morning O’s Breakfast Cereal
- Organic Sea Salt Potato Chips
- Organic Unsweetened Cocoa Powder
- Organic Ground Cinnamon
- Organic Coconut Sugar
- Organic Balsamic Vinegar
- Organic Extra Virgin Olive Oil

Never Miss an Important Article Again!
Join our Email List
Hi Tamara,
Thank you so much for your work.
Can you please remind me, you always send 50g of each product for testing?
No.
Different product types require that different amounts of product are sent in.
Different labs also have different requirements for material quantity for testing.
The parts per billion (ppb) results apply to any amount of a product (a pound, an ounce, a gram – the ppb value is the same). PPB should be seen as a percentage.
T
thank you.