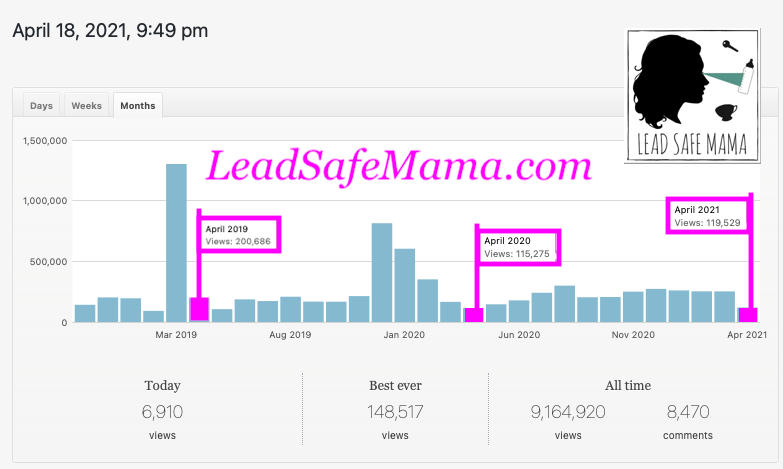
Following up on the stats post from the other day… Lead Safe Mama April Stats since 2014
#BestAprilEver | #Stats | #StatsChart | #StatsGraph | 2021 Stats | Site Stats | Stats | Stats Graph
Following up on THIS POST from the other day…
April 2021 just passed the total number of unique views that we had in April 2020, so there is some evidence of recovery from the pandemic… especially since there are still 12 days left in the month! Thank you for your ongoing support of this work, and thank you – especially – for sharing the posts on this blog that might help your family, friends and neighbors protect the children in their lives from being exposed to Lead.
- April 2014: 479 unique page views
- April 2015: 1,016 unique page views
- April 2016: 1,464 unique page views
- April 2017: 27,786 unique page views
- April 2018: 52,512 unique page views
- April 2019: 200,686 unique page views
- April 2020: 115,275 unique page views
- April 2021 (to date): 119,529 unique page views
Tamara Rubin
#LeadSafeMama

 Here’s a more complex analysis of the above chart
Key:
- Green Arrows: across a series of years where the unique page views each year for that same month saw an increase.
- Red Lines: when the year before had more views than the year after
- Pink Box: April – all years since the start of this blog.
Never Miss an Important Article Again!
Join our Email List


